Moving Average With Risk:Reward**Title: A Detailed Guide to Using the Moving Average With Risk:Reward Indicator**
The dynamic world of financial markets offers a myriad of opportunities for market participants to make profitable trades. However, to unlock these opportunities, traders require reliable tools to guide their decisions, tools such as technical indicators. One such indicator is the 'Moving Average With Risk:Reward' Indicator, a versatile tool that combines the simple moving average (SMA), exponential moving average (EMA), Average True Range (ATR) indicator, and automated entry, stop-loss, and take-profit markers to provide a comprehensive analysis of market trends. This article aims to detail the use and interpretation of this indicator.
**Understanding the Building Blocks**
1. **Moving Averages (SMA & EMA):**
Moving averages are arguably some of the most common tools used by traders worldwide. They help smooth out price data to form a trend following indicator. Our custom indicator utilizes both a 21-period SMA, which averages the closing prices of the past 21 periods, and a 9-period EMA, which gives more weight to recent prices. The difference in sensitivity between these two moving averages forms the basis of our trade signals.
2. **Average True Range (ATR):**
The ATR is an essential component of our indicator. It measures market volatility by decomposing the entire range of an asset price for that period. It plays a critical role in determining the stop loss and take profit levels in our indicator, as detailed later.
**How the Indicator Works**
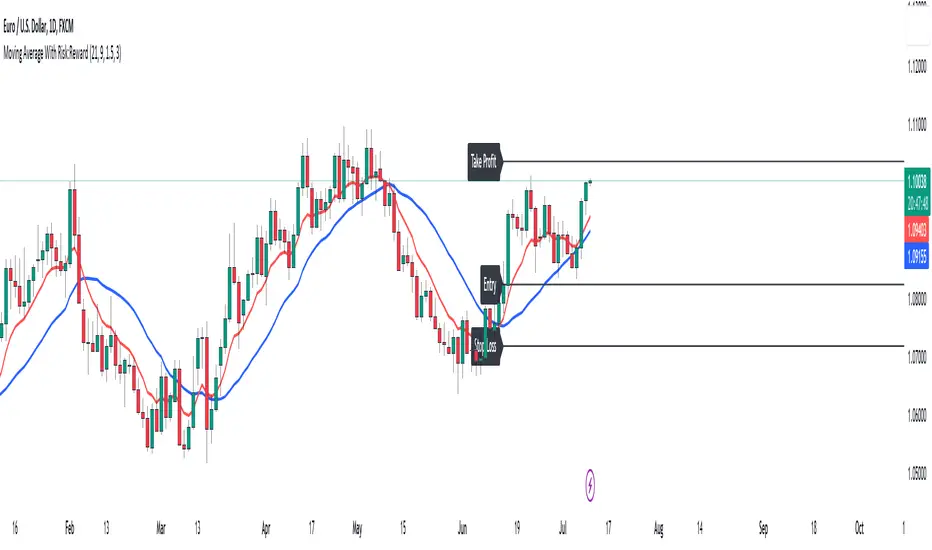
Our custom indicator works by generating buy or sell signals based on crossover and crossunder events between the SMA and EMA. A crossover occurs when the EMA (more sensitive to recent prices) crosses above the SMA, indicating upward momentum and hence triggering a buy signal. Conversely, a crossunder, where the EMA moves below the SMA, indicates increasing downward momentum and generates a sell signal.
Upon the generation of a signal, the indicator draws lines on the chart to represent the entry point, stop loss, and take profit levels. The user has the freedom to adjust the color of these lines for visual clarity. The script will also delete previous lines whenever a new signal is generated to avoid clutter and confusion.
**Determining the Stop Loss and Take Profit Levels**
Our custom indicator uses the ATR and a predetermined multiplier to calculate stop loss and take profit levels, thus incorporating market volatility into these critical decisions. The user can input their preferred multiplier for both stop loss and take profit.
Stop Loss (SL): SL is set at a level that is the ATR value multiplied by the stop-loss multiplier subtracted from (for a long position) or added to (for a short position) the closing price.
Take Profit (TP): Conversely, TP is set at a level that is the ATR value multiplied by the take-profit multiplier added to (for a long position) or subtracted from (for a short position) the closing price.
These SL and TP levels get plotted as horizontal lines on the chart, extending to the right. Labels are also placed to easily identify these levels.
**Making the Most of the Indicator**
A significant advantage of this indicator lies in its simplicity and clarity. Traders can clearly see the entry point, stop loss, and take profit levels on the chart. They can modify these levels based on their risk tolerance or trading strategy.
The combination of SMA and EMA offers the best of both worlds, with SMA providing a lagging, stable trend indication and EMA offering a more responsive indication to recent price changes. The indicator's use of ATR for SL and TP settings also ensures that these levels adapt to changing market volatility.
It is essential to remember that while this indicator can be an invaluable tool in a trader's arsenal, it is not infallible. Markets can often behave unpredictably, and even the most robust and reliable indicators can occasionally generate false signals. Therefore, traders should always employ sound money management strategies and use this indicator in conjunction with other technical analysis tools and fundamental analysis to confirm signals and make informed trading decisions.
In conclusion, the Moving Average With Risk:Reward indicator provides a comprehensive and versatile tool that can significantly enhance trading strategies. Its integration of trend-following moving averages, volatility-adjusted stop loss and take profit levels, and clear chart visualizations make it a potent tool in the financial markets. By fully understanding how to interpret and utilize this indicator, traders can navigate the markets with increased confidence and precision.
Pesquisar nos scripts por "Exponential Moving Average"
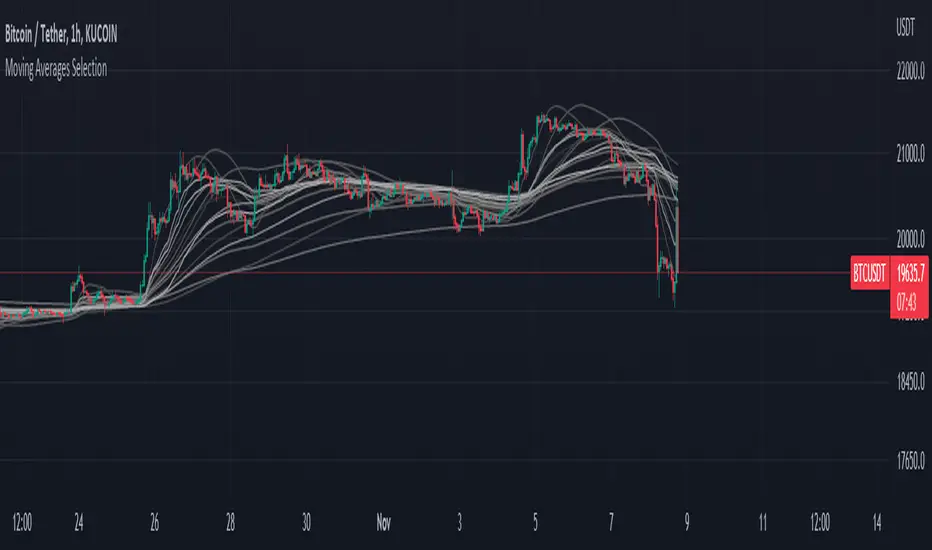
Moving Averages SelectionHello everyone, I present my first script. In it I collect a group of fully configurable moving averages, both in color, value and selection of the ones we want to observe.
The moving averages I collect are 3 of each of the following types:
EMA: An exponential moving average ( EMA ) is a type of moving average (MA) that places a greater weight and significance on the most recent data points.
SMA: It is simply the average price over the specified period. The average is called "moving" because it is plotted on the chart bar by bar, forming a line that moves along the chart as the average value changes.
HMA: The Hull Moving Average ( HMA ) attempts to minimize the lag of a traditional moving average while retaining the smoothness of the moving average line. Developed by Alan Hull in 2005, this indicator makes use of weighted moving averages to prioritize more recent values and greatly reduce lag.
RMA: The Rolling Moving Average, sometimes referred to as "Smoothed Moving Average", gives the recent prices most weighting, though the historic prices are also weighted, each given less weighting further back in time.
WMA: The weighted moving average ( WMA ) is a technical indicator that traders use to generate trade direction and make a buy or sell decision. It assigns greater weighting to recent data points and less weighting on past data points.
I am open to any opinion and advice for improvement, greetings, I hope you find it useful :)
TASC 2022.09 LRAdj EMA█ OVERVIEW
TASC's September 2022 edition of Traders' Tips includes an article by Vitali Apirine titled "The Linear Regression-Adjusted Exponential Moving Average". This script implements the titular indicator presented in this article.
█ CONCEPT
The Linear Regression-Adjusted Exponential Moving Average (LRAdj EMA) is a new tool that combines a linear regression indicator with exponential moving averages . First, the indicator accounts for the linear regression deviation, that is, the distance between the price and the linear regression indicator. Subsequently, an exponential moving average (EMA) smooths the price data and and provides an indication of the current direction.
As part of a trading system, LRAdj EMA can be used in conjunction with an exponential moving average of the same length to identify the overall trend. Alternatively, using LRAdj EMAs of different lengths together can help identify turning points.
█ CALCULATION
The script uses the following input parameters:
EMA Length
LR Lookback Period
Multiplier
The calculation of LRAdj EMA is carried out as follows:
Current LRAdj EMA = Prior LRAdj EMA + MLTP × (1+ LRAdj × Multiplier ) × ( Price − Prior LRAdj EMA ),
where MLTP is a weighting multiplier defined as MLTP = 2 ⁄ ( EMA Length + 1), and LRAdj is the linear regression adjustment (LRAdj) multiplier:
LRAdj = (Abs( Current LR Dist )−Abs( Minimum LR Dist )) ⁄ (Abs( Maximum LR Dist )−Abs( Minimum LR Dist ))
When calculating the LRAdj multiplier, the absolute values of the following quantities are used:
Current LR Dist is the distance between the current close and the linear regression indicator with a length determined by the LR Lookback Period parameter,
Minimum LR Dist is the minimum distance between the close and the linear regression indicator for the LR lookback period ,
Maximum LR Dist is the maximum distance between the close and the linear regression indicator for the LR lookback period .

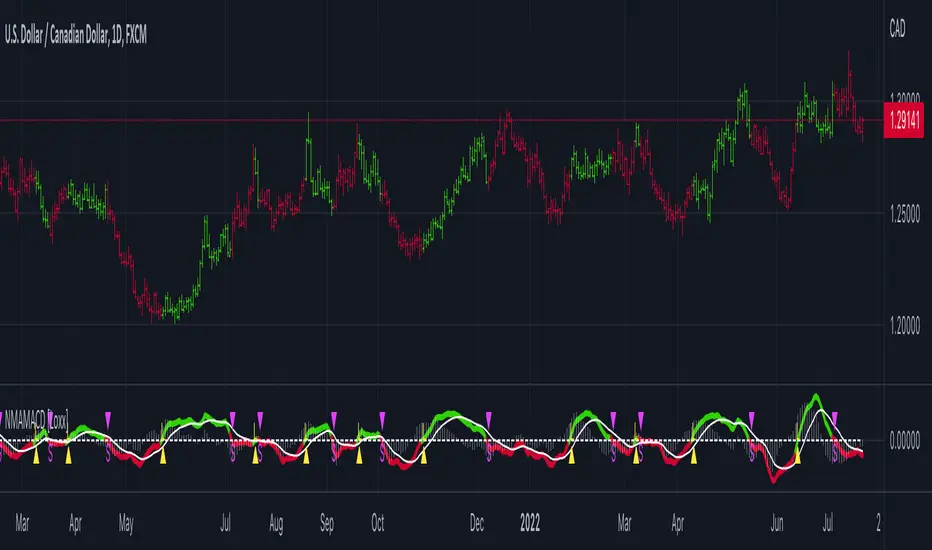
Nyquist Moving Average (NMA) MACD [Loxx]Nyquist Moving Average (NMA) MACD is a MACD indicator using Nyquist Moving Average for its calculation.
What is the Nyquist Moving Average?
A moving average outlined originally developed by Dr . Manfred G. Dürschner in his paper "Gleitende Durchschnitte 3.0".
In signal processing theory, the application of a MA to itself can be seen as a Sampling procedure. The sampled signal is the MA (referred to as MA.) and the sampling signal is the MA as well (referred to as MA). If additional periodic cycles which are not included in the price series are to be avoided sampling must obey the Nyquist Criterion.
It can be concluded that the Moving Averages 3.0 on the basis of the Nyquist Criterion bring about a significant improvement compared with the Moving Averages 2.0 and 1.0. Additionally, the efficiency of the Moving Averages 3.0 can be proven in the result of a trading system with NWMA as basis.
What is the MACD?
Moving average convergence divergence (MACD) is a trend-following momentum indicator that shows the relationship between two moving averages of a security’s price. The MACD is calculated by subtracting the 26-period exponential moving average (EMA) from the 12-period EMA.
The result of that calculation is the MACD line. A nine-day EMA of the MACD called the "signal line," is then plotted on top of the MACD line, which can function as a trigger for buy and sell signals. Traders may buy the security when the MACD crosses above its signal line and sell—or short—the security when the MACD crosses below the signal line. Moving average convergence divergence (MACD) indicators can be interpreted in several ways, but the more common methods are crossovers, divergences, and rapid rises/falls.
Included
Bar coloring
2 types of signal output options
Alerts
Loxx's Expanded Source Types
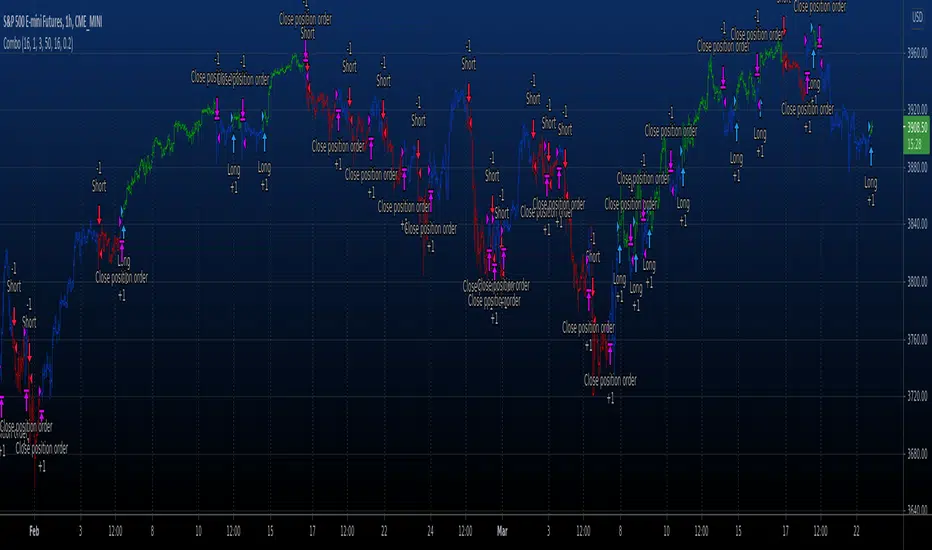
Fukuiz Octa-EMA + Ichimoku (Strategy)This strategy is based EMA of 8 different period and Ichimoku Cloud which works better in 1hr 4hr and daily time frame.
#A brief introduction to Ichimoku #
The Ichimoku Cloud is a collection of technical indicators that show support and resistance levels, as well as momentum and trend direction. It does this by taking multiple averages and plotting them on a chart. It also uses these figures to compute a “cloud” that attempts to forecast where the price may find support or resistance in the future.
#A brief introduction to EMA#
An exponential moving average ( EMA ) is a type of moving average (MA) that places a greater weight and significance on the most recent data points. The exponential moving average is also referred to as the exponentially weighted moving average . An exponentially weighted moving average reacts more significantly to recent price changes than a simple moving average ( SMA ), which applies an equal weight to all observations in the period.
#How to use#
The strategy will give entry points itself, you can monitor and take profit manually(recommended), or you can use the exit setup.
EMA (Color) = Bullish trend
EMA (Gray) = Bearish trend
#Condition#
Buy = All Ema (color) above the cloud.
SELL= All Ema turn to gray color.

EMA/Session/ATR/LotSizeSeveral indicators combined
1. 6 Exponential Moving Averages - Identifying the trend direction or using EMAs as a dynamic support/resistance.
2. Session on Chart - Highlighting session for day trading. London, New York, Tokyo, and Sydney.
3. Average True Range - display the Average True Range on recent price to calculate the volatility.
4. Lot Size Calculator - to calculate lot size based on account balance, risk per trade, atr stop-loss, and art multiplier.
5. ATRX - ATRX is an indicator that gives the value of the (close price - EMA 27)/ATR (14)
It tells how strong the trend is compared to its volatility
According to AJ. BANK FTMO Trader Thailand, if the value of ATRX is between 2X-3X or -2X-3X, you should consider trading using climax zone on timeframe H1.
If the ATRX is more than 3X or less than -3X but does not exceed 4X or -4X, you should consider trading using timeframe M15 in the climax zone.
However, if the ATRX exceeds 4X or -4X, use M5 instead.

Logarithmic Bollinger BandsLogarithmic Bollinger Bands
Published by Eric Thies on January 14, 2022
Summary
In this script I have taken the standard Bollinger band pinescript and made efforts to eliminate the behavior experienced in periods of high volatility in which we see the bands disappear completely off the chart by adding exponential plotting and logarithmic sourcing to the tool.
This tool will also show periods of Bearish and Bullish Expansion for users to see when volatility is running high in the market.
More On Bollinger Bands
Bollinger Bands consist of a center line representing the moving average of a security’s price over a certain period, and two additional parallel lines (called the upper and lower trading bands) one of which is just the moving average plus k-times the standard deviation over the selected time frame, and the other being the moving average minus k-times the standard deviation over that same timeframe. This technique has been developed in the 1980’s by John Bollinger, who lately registered the terms “Bollinger Bands” as a U.S. trademark in 2011. Technical analysts typically use 20 periods and k = 2 as default settings to build Bollinger Bands, while they can choose a simple or exponential moving average. Bollinger Bands provide a relative definition of high and low prices of a security. When the security is trading within the upper band, the price is considered high, while it is considered low when the security is trading within the lower band.
There is no general consensus on the use of Bollinger Bands among traders. Some traders see a buy signal when the price hits the lower Bollinger Band and close their position when the price hits the moving average. Some others buy when the price crosses over the upper band and sell when the price crosses below the lower band. We can see here two opposing interpretations based on different rationales, depending whether we are in a reversal or continuation pattern. Another interesting feature of the Bollinger Bands is that they give an indication of the volatility levels; a widening gap between the upper and lower bands indicates an increasing volatility, while a narrowing band indicates a decreasing volatility. Moreover, when the bands have an almost flat slope (parallel to the x-axis) the price will generally oscillate between the bands as if trading through a channel.
// © 2022 KINGTHIES THIS SOURCE CODE IS SUBJECT TO TERMS OF MOZILLA PUBLIC LICENSE 2.0 (MOZILLA.ORG/MPL/2.0)
//@version=5
//## !<---------------- © KINGTHIES --------------------->
indicator('Logarithmic Bollinger Bands (kingthies)',shorttitle='LogBands_KT',overlay=true)
// { BBANDS
src = math.log(input(close,title="Source"))
lenX = input(20,title='lenX')
highlights = input(false,title="Highlight Bear and Bull Expansions?")
mult = 2
bbandBasis = ta.sma(src,lenX)
dev = 2 * ta.stdev(src, 20)
upperBB = bbandBasis + dev
lowerBB = bbandBasis - dev
bbw = (upperBB-lowerBB)/bbandBasis
bbr = (src - lowerBB)/(upperBB - lowerBB)
// }
// { BBAND EXPANSIONS
bullExp= ta.rising(upperBB,1) and ta.falling(lowerBB,1) and ta.rising(bbandBasis,1) and ta.rising(bbw,1) and ta.rising(bbr,1)
bearExp= ta.rising(upperBB,1) and ta.falling(lowerBB,1) and ta.falling(bbandBasis,1) and ta.rising(bbw,1) and ta.falling(bbr,1)
// }
// { COLORS
greenBG = color.rgb(9,121,105,75), redBG = color.rgb(136,8,8,75)
bullCol = highlights and bullExp ? greenBG : na, bearCol = highlights and bearExp ? redBG : na
// }
// { INDICATOR PLOTTING
lowBB=plot(math.exp(lowerBB),title='Low Band',color=color.aqua),plot(math.exp(bbandBasis),title='BBand Basis',color=color.red),
highBB=plot(math.exp(upperBB),title='High Band',color=color.aqua),fill(lowBB,highBB,title='Band Fill Color',color=color.rgb(0,128,128,75))
bgcolor(bullCol,title='Bullish Expansion Highlights'),bgcolor(bearCol,title='Bearish Expansion Highlights')
// }

Kelt + BBand Combination (kingthies) █ Overview
The Kelt-BBand Combo is a trading approach that I've used for multiple years now, and works on any timeframe, chart possible. There are various versions of this approach published by myself and others who find value in measuring the deviations of price and strategize market entries and exits. For an entry-level description of each component, I'll type them up below.
█ Using This Indicator
While there are various strategies to use this tool, I'll share the one that has yielded me the most success across traditional and cryptocurrency markets - first understand the different appearances of both....
IF the bbands are inside the kelts, the squeeze is on. In 90% of cases this is often a bullish leaning event
IF the bbands are pinching (regardless of slope or kelt behavior),these are your primary support and resistances, respectively
When trending up, HA candles will touch between the upper kelt and upper bband on every candle, across all timeframes
When trending down, HA candles will touch between the lower kelt and lower bband on every candle, across all timeframes
If one timeframe is not giving clear indicator of trend direction or s/r to follow, zoom out. the higher timeframe will always win and show you the true direction
█ Intro to Bollinger Bands
Bollinger Bands consists of a center line representing the moving average of a security’s price over a certain period, and two additional parallel lines (called the trading bands) one of which is just the moving average plus k-times the standard deviation over the selected time frame, and the other being the moving average minus k-times the standard deviation over that same timeframe. This technique has been developed in the 1980’s by John Bollinger, who lately registered the terms “Bollinger Bands” as a U.S. trademark in 2011. Technical analysts typically use 20 periods and k = 2 as default settings to build Bollinger Bands, while they can choose a simple or exponential moving average. Bollinger Bands provide a relative definition of high and low prices of a security. When the security is trading within the upper band, the price is considered high, while it is considered low when the security is trading within the lower band.
There is no general consensus on the use of Bollinger Bands among traders. Some traders see a buy signal when the price hits the lower Bollinger Band and close their position when the price hits the moving average. Some others buy when the price crosses over the upper band and sell when the price crosses below the lower band. We can see here two opposing interpretations based on different rationales, depending whether we are in a reversal or continuation pattern. Another interesting feature of the Bollinger Bands is that they give an indication of the volatility levels; a widening gap between the upper and lower bands indicates an increasing volatility, while a narrowing band indicates a decreasing volatility. Moreover, when the bands have an almost flat slope (parallel to the x-axis) the price will generally oscillate between the bands as if trading through a channel.
█ Intro to Keltner Channels
Keltner Channels aka Kelts were first described by a Chicago grain trader called Chester W. Keltner in his 1960 book How to Make Money in Commodities. Though Keltner claimed no ownership of the original idea and simply called it the ten-day moving average trading rule, his name was applied by those who heard of this concept through his books.
Similarly to the Bollinger Bands, Keltner channel is a technical analysis tool based on three parallel lines. In fact, the Keltner indicator consists of a central moving average in addition to channel lines spread above and below it. The central line represents a 10-day simple moving average of what Chester W. Keltner called typical price. The typical price is defined as the average of the high, low and close. The distance between the central line and the upper, or lower line, is equivalent to the simple moving average of the preceding 10 days' trading ranges.
One way to interpret the Keltner Channel would be to consider the price breakouts outside of the channel. A trader would track price movement and consider any close above the upper line as a strong buy signal. Equivalently, any close below the lower line would be considered a strong sell signal. The trader would follow the trend emphasized by the indicator while complementing his analysis with the use of other indicators as well. However, the breakout method only works well when the market moves from a range-bound setting to an established trend. In a trend-less configuration, the Keltner Channel is better used as an overbought/oversold indicator. Thus, as the price breaks out below the lower band, a trader waits for the next close inside the Keltner Channel and considers this price behavior as an oversold situation indicating a potential buy signal. Similarly, as the price breaks out above the upper band, the trader waits for the next close inside the Keltner Channel and considers this price movement as an overbought situation indicating a potential sell signal. By waiting for the price to close within the Channel, the trader avoids getting caught in a real upside or downside breakout.
Happy Trading!

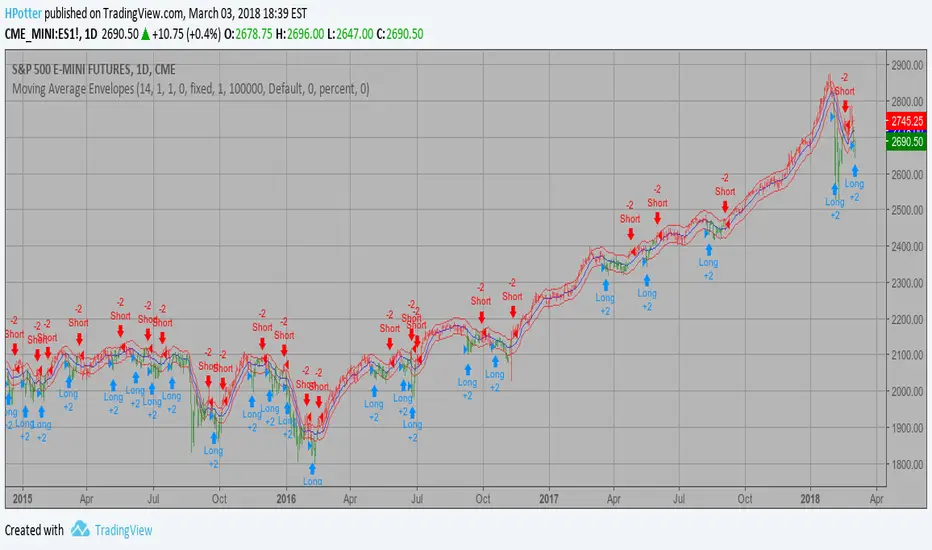
Combo Backtest 123 Reversal & Moving Average Envelopes This is combo strategies for get a cumulative signal.
First strategy
This System was created from the Book "How I Tripled My Money In The
Futures Market" by Ulf Jensen, Page 183. This is reverse type of strategies.
The strategy buys at market, if close price is higher than the previous close
during 2 days and the meaning of 9-days Stochastic Slow Oscillator is lower than 50.
The strategy sells at market, if close price is lower than the previous close price
during 2 days and the meaning of 9-days Stochastic Fast Oscillator is higher than 50.
Second strategy
Moving Average Envelopes are percentage-based envelopes set above and
below a moving average. The moving average, which forms the base for
this indicator, can be a simple or exponential moving average. Each
envelope is then set the same percentage above or below the moving average.
This creates parallel bands that follow price action. With a moving average
as the base, Moving Average Envelopes can be used as a trend following indicator.
However, this indicator is not limited to just trend following. The envelopes
can also be used to identify overbought and oversold levels when the trend is
relatively flat.
WARNING:
- For purpose educate only
- This script to change bars colors.
Adjustable Moving AveragesAdjustable Moving Averages
This script has fixed simple moving averages and fixed exponential moving averages function.
And script has 2 lines
1. Simpe Moving Average Line
2. Exponential Moving Average Line
You can change this 2 lines length and also you can change periods aswell.
With this; you can use any length of sma and ema with different periods without changing period.
For example this chart on 1 day period
And you can see 2 lines
Red Line: SMA100 and 4H perioıd
Yellow Line : EMA100 and 4H period

Multiple Time Frames Moving Averages (x3)This indicator is a set of 3 moving averages for which you can configure the type of the moving averages , their length , and of course the time frame . The moving averages you can choose from are:
- Simple Moving Average ( SMA )
- Exponential Moving Average ( EMA )
- Weighted Moving Average ( WMA )
- Running Moving Average (RMA)
- Hull Moving Average ( HMA )
- Volume Weighted Moving Average ( VWMA )
- Arnaud Legoux Moving Average ( ALMA )
The time-frames you can choose from - minutes (1, 3, 5, 15, 45), hours (1, 2, 3, 4, 12), days (1, 3), weekly or monthly .
Overall, it is a minimalistic indicator. No major improvements or trading logic like some of my other indicators, but I did make it slightly easier to use and visually appealing. The MAs' colors change from light to dark green/blue/red depending on the trend - bullish or bearish respectively. Initially, those were changing from green to red (based on direction) but it became a bit confusing when they started crossing each other. Anyway, feel free to change those colors to whatever you like.
If you have suggestions on how to improve this indicator or ideas about new ones, please drop me a line. Thanks.

PMax Explorer STRATEGY & SCREENERProfit Maximizer - PMax Explorer STRATEGY & SCREENER screens the BUY and SELL signals (trend reversals) for 20 user defined different tickers in Tradingview charts.
Simply input the name of the ticker in Tradingview that you want to screen.
Terminology explanation:
Confirmed Reversal: PMax reversal that happened in the last bar and cannot be repainted.
Potential Reversal: PMax reversal that might happen in the current bar but can also not happen depending upon the timeframe closing price.
Downtrend: Tickers that are currently in the sell zone
Uptrend: Tickers that are currently in the buy zone
Screener has also got a built in PMax indicator which users can confirm the reversals on graphs.
Screener explores the 20 tickers in current graph's time frame and also in desired parameters of the SuperTrend indicator.
Also you can optimize the parameters manually with the built in STRATEGY version.
PMax indicator :
Profit Maximizer - PMax is a brand new indicator developed by me.
It's a combination of two trailing stop loss indicators;
One is Anıl Özekşi's MOST (Moving Stop Loss) Indicator
and the other one is well known ATR based SuperTrend
Profit Maximizer - PMax tries to solve this problem. PMax combines the powerful sides of MOST (Moving Average Trend Changer) and SuperTrend (ATR price detection) in one indicator.
Backtest and optimization results of PMax are far better when compared to its ancestors MOST and SuperTrend. It reduces the number of false signals in sideways and give more reliable trade signals.
PMax is easy to determine the trend and can be used in any type of markets and instruments. It does not repaint.
The first parameter in the PMax indicator set by the three parameters is the period/length of ATR.
The second Parameter is the Multiplier of ATR which would be useful to set the value of distance from the built in Moving Average.
I personally think the most important parameter is the Moving Average Length and type.
PMax will be much sensitive to trend movements if Moving Average Length is smaller. And vice versa, will be less sensitive when it is longer.
As the period increases it will become less sensitive to little trends and price actions.
In this way, your choice of period, will be closely related to which of the sort of trends you are interested in.
We are under the effect of the uptrend in cases where the Moving Average is above PMax;
conversely under the influence of a downward trend, when the Moving Average is below PMax.
Built in Moving Average type defaultly set as EMA but users can choose from 8 different Moving Average types like:
SMA : Simple Moving Average
EMA : Exponential Movin Average
WMA : Weighted Moving Average
TMA : Triangular Moving Average
VAR : Variable Index Dynamic Moving Average aka VIDYA
WWMA : Welles Wilder's Moving Average
ZLEMA : Zero Lag Exponential Moving Average
TSF : True Strength Force
Tip: In sideways VAR would be a good choice
You can use PMax default alarms and Buy Sell signals like:
1-
BUY when Moving Average crosses above PMax
SELL when Moving Average crosses under PMax
2-
BUY when prices jumps over PMax line.
SELL when prices go under PMax line.

Profit Maximizer PMaxPMax is a brand new indicator developed by KivancOzbilgic in earlier 2020.
It's a combination of two trailing stop loss indicators;
One is Anıl Özekşi's MOST (Moving Stop Loss) Indicator
and the other one is well known ATR based SuperTrend.
Both MOST and SuperTrend Indicators are very good at trend following systems but conversely their performance is not bright in sideways market conditions like most of the other indicators.
Profit Maximizer - PMax tries to solve this problem. PMax combines the powerful sides of MOST (Moving Average Trend Changer) and SuperTrend (ATR price detection) in one indicator.
Backtest and optimization results of PMax are far better when compared to its ancestors MOST and SuperTrend. It reduces the number of false signals in sideways and give more reliable trade signals.
PMax is easy to determine the trend and can be used in any type of markets and instruments. It does not repaint.
The first parameter in the PMax indicator set by the three parameters is the period/length of ATR.
The second Parameter is the Multiplier of ATR which would be useful to set the value of distance from the built in Moving Average.
I personally think the most important parameter is the Moving Average Length and type.
PMax will be much sensitive to trend movements if Moving Average Length is smaller. And vice versa, will be less sensitive when it is longer.
As the period increases it will become less sensitive to little trends and price actions.
In this way, your choice of period, will be closely related to which of the sort of trends you are interested in.
We are under the effect of the uptrend in cases where the Moving Average is above PMax;
conversely under the influence of a downward trend, when the Moving Average is below PMax.
Built in Moving Average type defaultly set as EMA but users can choose from 8 different Moving Average types like:
SMA : Simple Moving Average
EMA : Exponential Movin Average
WMA : Weighted Moving Average
TMA : Triangular Moving Average
VAR : Variable Index Dynamic Moving Average aka VIDYA
WWMA : Welles Wilder's Moving Average
ZLEMA : Zero Lag Exponential Moving Average
TSF : True Strength Force
Tip: In sideways VAR would be a good choice
You can use PMax default alarms and Buy Sell signals like:
1-
BUY when Moving Average crosses above PMax
SELL when Moving Average crosses under PMax
2-
BUY when prices jumps over PMax line.
SELL when prices go under PMax line.

Show EMA and SMA's at the same timeYou can now add both exponential and simple moving averages at the same time. ie a 7 day Simple Moving Average and a 21 day Exponential Moving Average.

Advanced MACDThis is a more advanced version of the standard moving average convergence/divergence indicator (MACD). It allows you to change the type of all moving averages (Simple, Exponential, Weighted, Volume-weighted, Triple EMA or a moving average that uses RSI). By for example setting the period to 3/10/16 and use simple moving averages instead of exponential moving averages you can turn it into the modified version of the MACD oscillator (mMACD) described in detail in Appendix B in the book "The Art and Science of Technical Analysis: Market Structure, Price Action and Trading Strategies" by Adam Grimes.
The indicator also allows you to volume weight the indicator (turned on by default), which will turn it into a Volume-Weighted Moving Average Convergence Divergence (VW-MACD) first used by Buff Pelz Dormeier in 2002 and described in detail in his book "Investing with Volume Analysis: Identify, Follow, and Profit from Trends". If you want to weight the oscillator against the true range instead of volume this is also possible. By default, this will be done automatically for assets that do not support volume.

MASelect Crossover StratBasic Crossover Strategy for backtesting purposes, to use with the study+alert script.
Use "Format" to change your settings. Both Moving Averages can be changed individually to swap between EMA (Exponential Moving Average), SMA (Simple Moving Average), WMA (Weighted Moving Average), DEMA (Double Exponential Moving Average) and VWMA (Volume Weighted Moving Average).
"Active Length" should be shorter than "Base Length". As usual with crossover strategies, candle resolution will affect results greatly. Longer=better.
Strategy options are "Long+Short" or "Long Only".
Entries/Exits are based on crossovers/crossunders only, but I encourage you to add further exit conditions and play around with the code.
I made this for beginners on Autoview discord to have something to play with, and added some unnecessary visual changes just to give code examples (changing things like background color, candle color, line color, plotting shapes, different plot styles).
Play around combining different types of Moving Averages of different lengths.

Moving Average Envelopes Backtest Moving Average Envelopes are percentage-based envelopes set above and
below a moving average. The moving average, which forms the base for
this indicator, can be a simple or exponential moving average. Each
envelope is then set the same percentage above or below the moving average.
This creates parallel bands that follow price action. With a moving average
as the base, Moving Average Envelopes can be used as a trend following indicator.
However, this indicator is not limited to just trend following. The envelopes
can also be used to identify overbought and oversold levels when the trend is
relatively flat.
You can change long to short in the Input Settings
WARNING:
- For purpose educate only
- This script to change bars colors.
Moving Average Envelopes Moving Average Envelopes are percentage-based envelopes set above and
below a moving average. The moving average, which forms the base for
this indicator, can be a simple or exponential moving average. Each
envelope is then set the same percentage above or below the moving average.
This creates parallel bands that follow price action. With a moving average
as the base, Moving Average Envelopes can be used as a trend following indicator.
However, this indicator is not limited to just trend following. The envelopes
can also be used to identify overbought and oversold levels when the trend is
relatively flat.
WARNING:
- This script to change bars colors.

Moving Average Envelopes Moving Average Envelopes are percentage-based envelopes set above and
below a moving average. The moving average, which forms the base for
this indicator, can be a simple or exponential moving average. Each
envelope is then set the same percentage above or below the moving average.
This creates parallel bands that follow price action. With a moving average
as the base, Moving Average Envelopes can be used as a trend following indicator.
However, this indicator is not limited to just trend following. The envelopes
can also be used to identify overbought and oversold levels when the trend is
relatively flat.

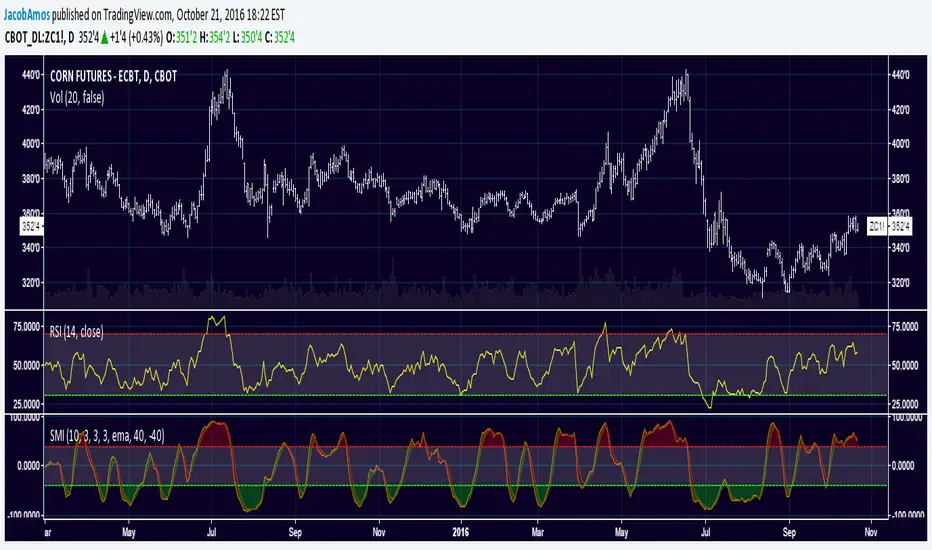
Money Flow Indicator (Chaikin Oscillator) Strategy Indicator plots Money Flow Indicator (Chaikin). This indicator looks
to improve on Larry William's Accumulation Distribution formula that
compared the closing price with the opening price. In the early 1970's,
opening prices for stocks stopped being transmitted by the exchanges.
This made it difficult to calculate Williams' formula. The Chaikin
Oscillator uses the average price of the bar calculated as follows
(High + Low) /2 instead of the Open.
The indicator subtracts a 10 period exponential moving average of the
AccumDist function from a 3 period exponential moving average of the
AccumDist function.
WARNING:
This script to change bars colors.

Multi Movings Averages
This tool can plot a maximum of 10 movings averages that are easily adaptable and configurable.
You can also use a exponential moving average instead of the simple moving average.
hope you enjoy :)

Stochastic Momentum IndexThis is an implementation of the Stochastic Momentum Index from William Blau's his article in Stocks & Commodities .
This also allows the use of various different kinds of moving averages for the signal line. Options for this argument are:
sma (simple moving average)
ema (exponential moving average)
wma (weighted moving average)
trima (triangular moving average)
zlema (zero-lag exponential moving average)
dema (double exponential moving average)
tema (triple exponential moving average)
hma (hull moving average)
EMAs Bullish/Bearish Confluence [Trend Bias]EMA Confluence Zones
This indicator is designed to simplify trend identification by visually highlighting "Confluence Zones" —areas where short-term, medium-term, and long-term momentum are fully aligned.
While traders can manually add three Moving Averages to a chart, identifying the exact moment all three align (the "Perfect Stack") can be visually difficult during live trading. This script automates that process, converting complex line crosses into simple background color zones and providing actionable alerts for the exact moment a trend alignment begins.
🛠 How It Works
The script utilizes three customizable Exponential Moving Averages (EMAs) to detect the market bias:
Short EMA: Represents immediate price action/momentum.
Medium EMA: Represents the intermediate trend.
Long EMA: Represents the major trend baseline.
Calculations & Logic
The indicator checks for a specific hierarchical alignment (Stacking) of these averages:
1. 🟢 Bullish Confluence (Buy Zone):** Returns true when `Short > Medium` AND `Medium >Long`. This confirms that momentum is rising across all three monitored timeframes.
2. 🔴 Bearish Confluence (Sell Zone):** Returns true when `Short < Medium` AND `Medium < Long`. This confirms that momentum is falling across all three monitored timeframes.
3. ⚪ Neutral (No Color): Any other state indicates a choppy or consolidating market where the EMAs are intertwined.
---
🚀 Key Features
*Visual Bias Confirmation: The background highlights Green (Bullish) or Red (Bearish) only when the "Perfect Stack" conditions are met.
Trend Start Alerts: Unlike standard EMA cross alerts, this script includes custom alert conditions that trigger only on the first bar where the confluence becomes valid. This prevents spam alerts during a prolonged trend.
Full Customization: Users can adjust the lengths of all three EMAs to fit specific strategies (e.g., Scalping vs. Swing Trading).
Clean Chart Mode: Includes options to hide the EMA lines entirely and rely solely on the background color for a minimalist "Naked Trading" setup.
🎯 How to Use
1. Trend Filter: Use the background color to determine your directional bias. If the background is Green, look only for Long setups on lower timeframes. If Red, look only for Short setups.
2. Breakout Confirmation: If price breaks a key level, wait for the background color to flip. This confirms that the Moving Averages have caught up to the move, validating the breakout strength.
3. Exit Signal: If you are in a trend trade and the background color disappears (turns transparent), it indicates the trend momentum is fading and the EMAs are beginning to cross/compress.
⚙️ Settings
EMA Lengths: Default is 20, 50, 100. These can be changed to common combinations like (9, 21, 55) or (50, 100, 200).
Visuals: Toggle lines or background colors on/off and adjust transparency to keep your chart readable.
---
Disclaimer: This script is for informational purposes only. Past performance of a trend following method does not guarantee future results. Always use proper risk management.
